May 4th, 2024
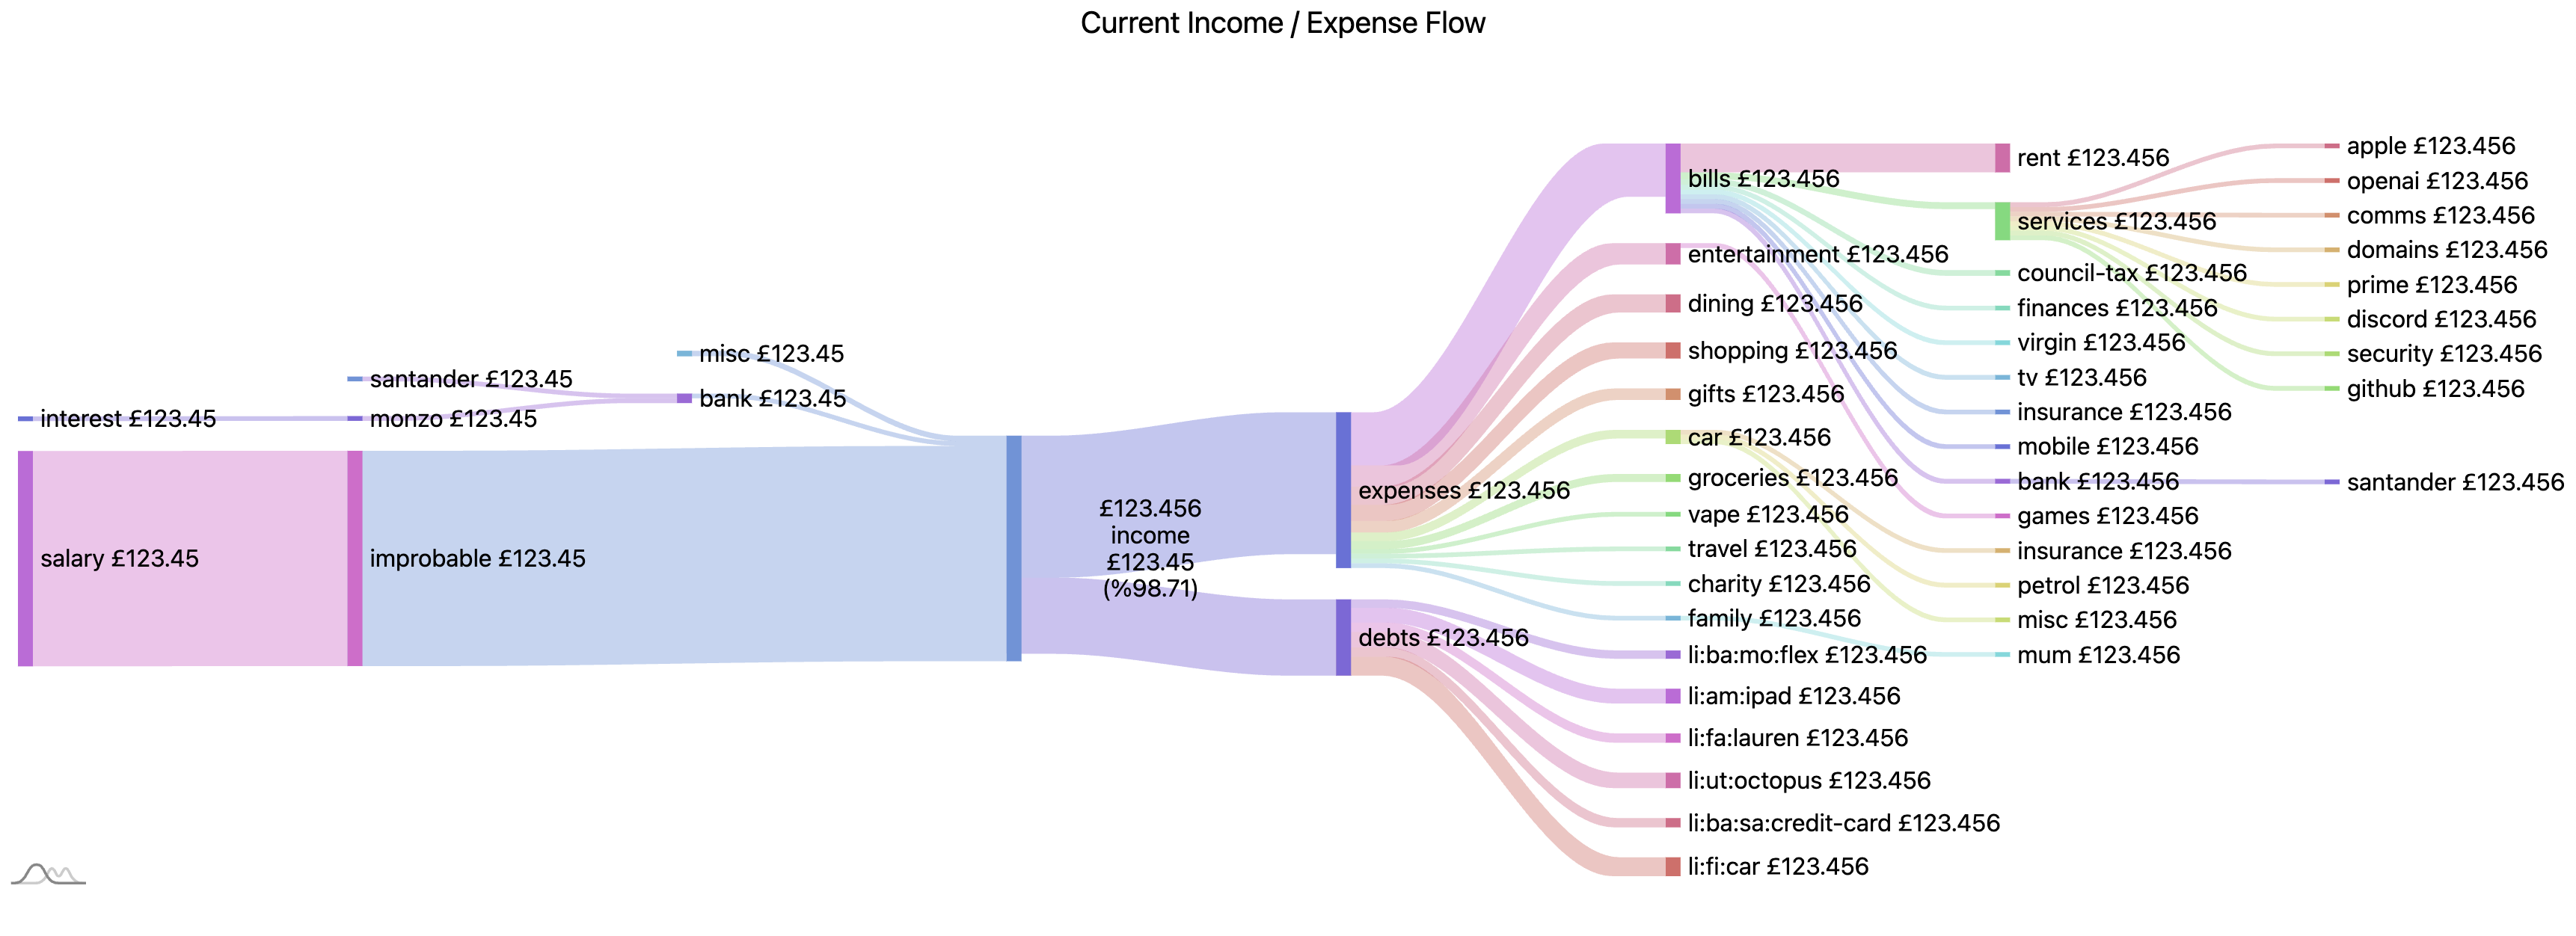
A while back I started to do some work to visualise my data spending habits my plan was to project my spending and savings on the wall so I constantly saw how it was going and therefore pulled up on my spending.
I got pretty far at processing data in order to show something
- Using a service called Emma I could download CSV data from connected banks
- I would then manually parse this
hledgera cli based double ledger system which could import CSV’s with a rule set. This also allowed me to create “accounts” which I could assign transactions to I could export the accounts data in to JSON with a terrible schema - With a go program I would then export some JSON from
hledgerand process it to be used withHighchartsto generate a Sankey diagram showing the flow of money as we can see below
This was good enough but was quite a process and required a lot of processing to handle
- Emma sends an email which you can then download the data
hledgerrequires you to go over the import data- you need to run the golang app to see the image
- having worked with vinh with data pipelines I’m wondering if that is the way I should be going about this?
- I should be able to automate grabbing the data from Emma
- Accounts are nice, but I wonder if it would be better to model in SQL rather than in
hledger - I can produce processed raw data, as well as charting data to be used by a much simpler service. The go code to process the
hledgeroutput is quite a lot and very messy. it would have been easier to have used Python at the least…
- I have plenty of compute to do this at home, that workstation that I got from work
- It would be nice to host this as I would in the modern way, so a k8s runtime so I can learn that as well
- Airflow is free, and so is DBT, this would allow me to use both of these tools well
